Data is beautiful
Design is an amazing way to help communicate data and information. I’ve been working on creating engaging infographics and data visuals for a large part of my experience ar MFV. Below you can find some of the most successful creations.
-
MVF (Startups, Expert Market, Movehub) LICKD, Tonkean
-
Project Lead and Art direction
-
2 weeks of work for each piece
Problem
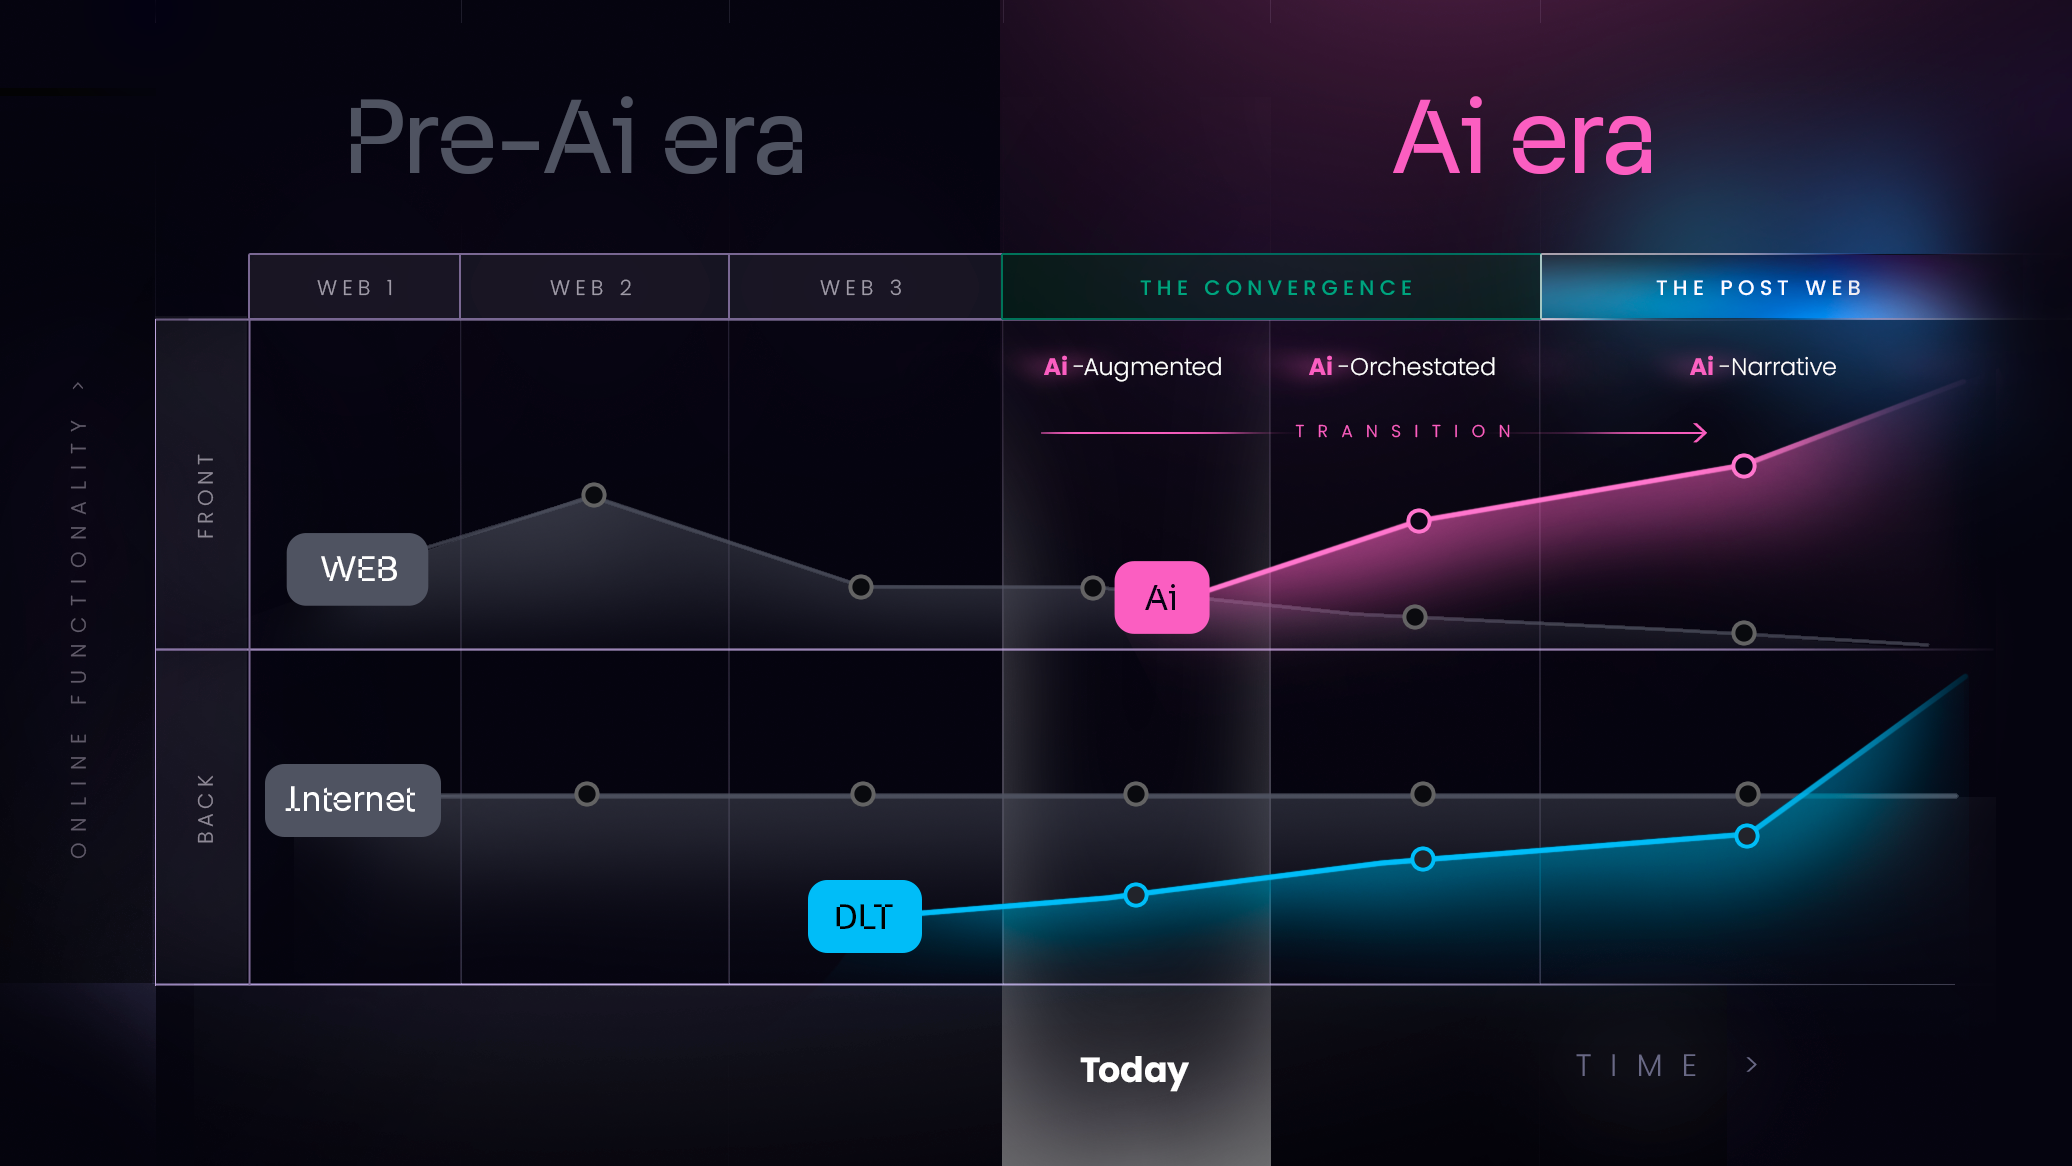
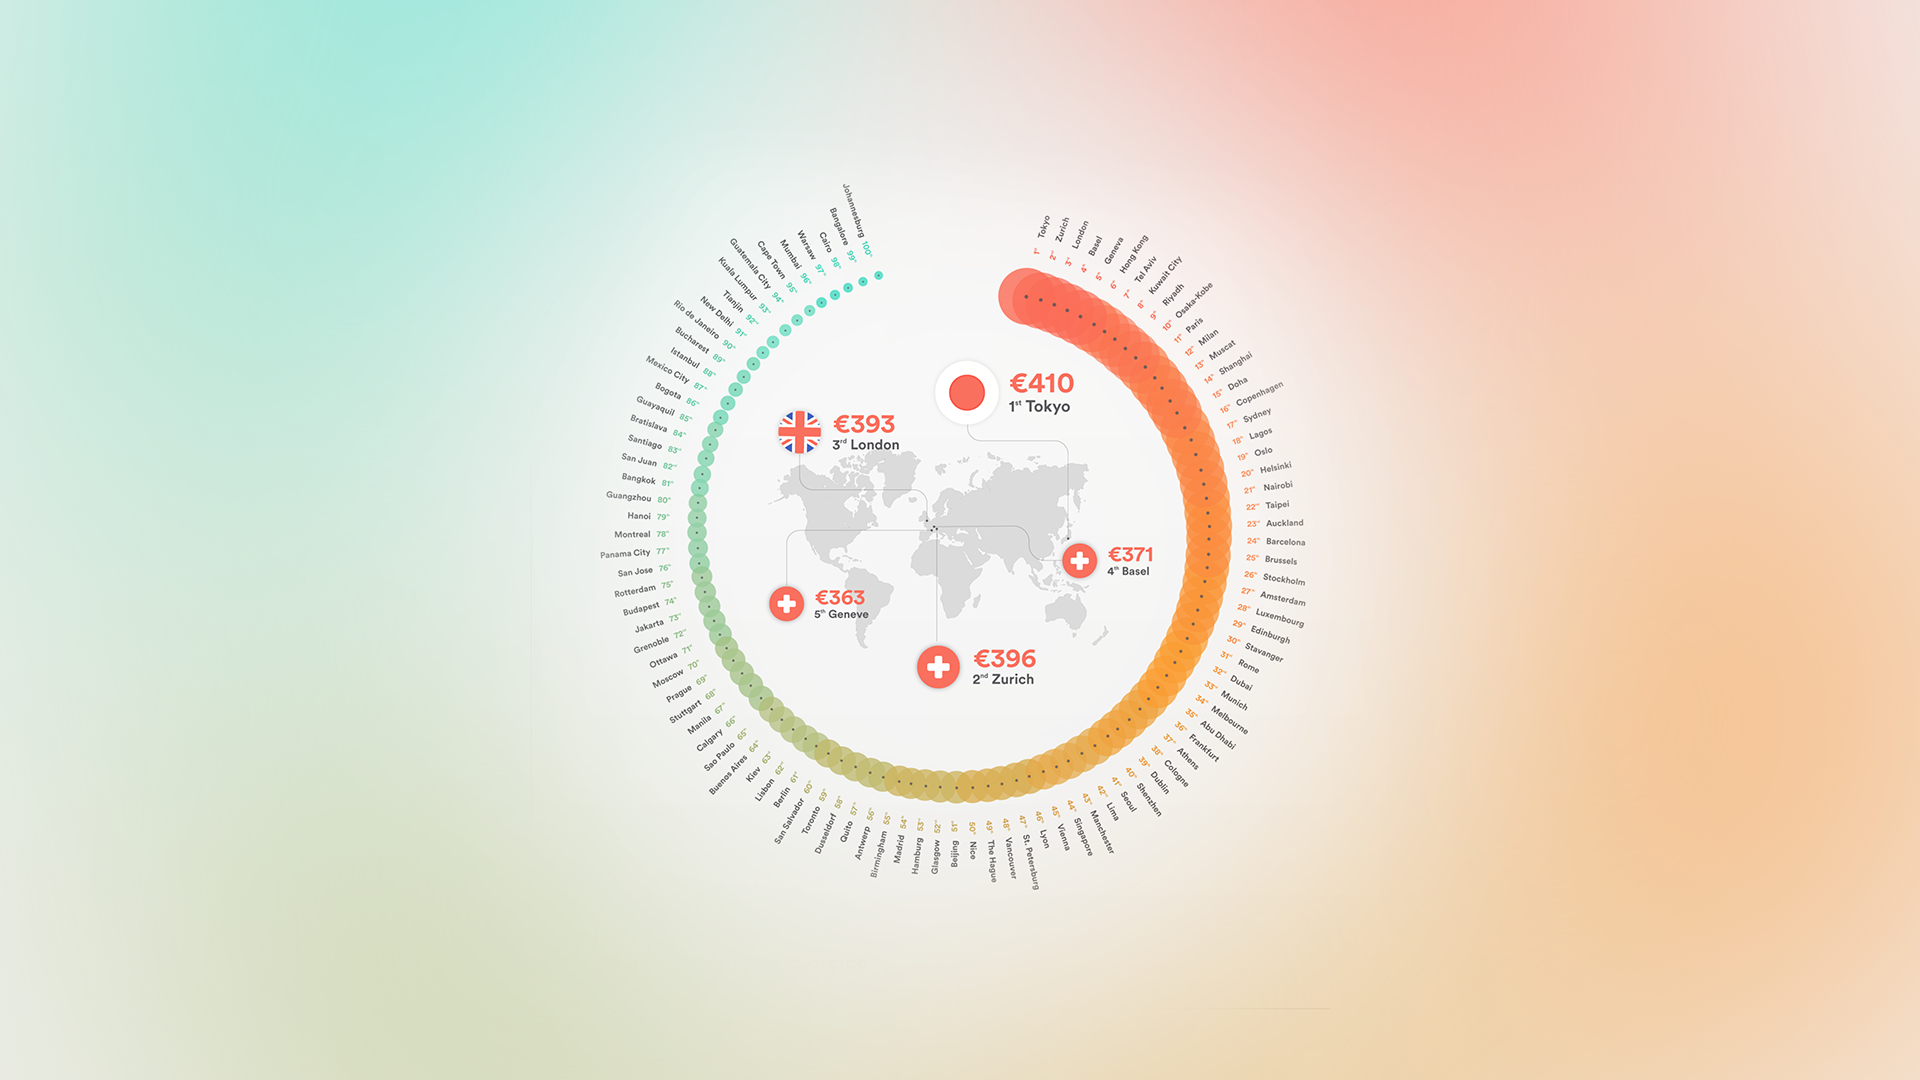
Data is incredibly valuable when it comes to sharing important information. However, this is a very dry medium, therefore I found it important to create engaging visuals to digest the information in a concise way.
Solution
Hierarchy, colours and contrast are some of the key pillars of a good infographic. The balance between text and visuals also helps to make everything more pleasing for the eyes.
Learning
This can be a complicated format, therefore the simpler solution is often the best. Making this visually simple is a practical way to balance layouts and keep them relevant to the viewer.